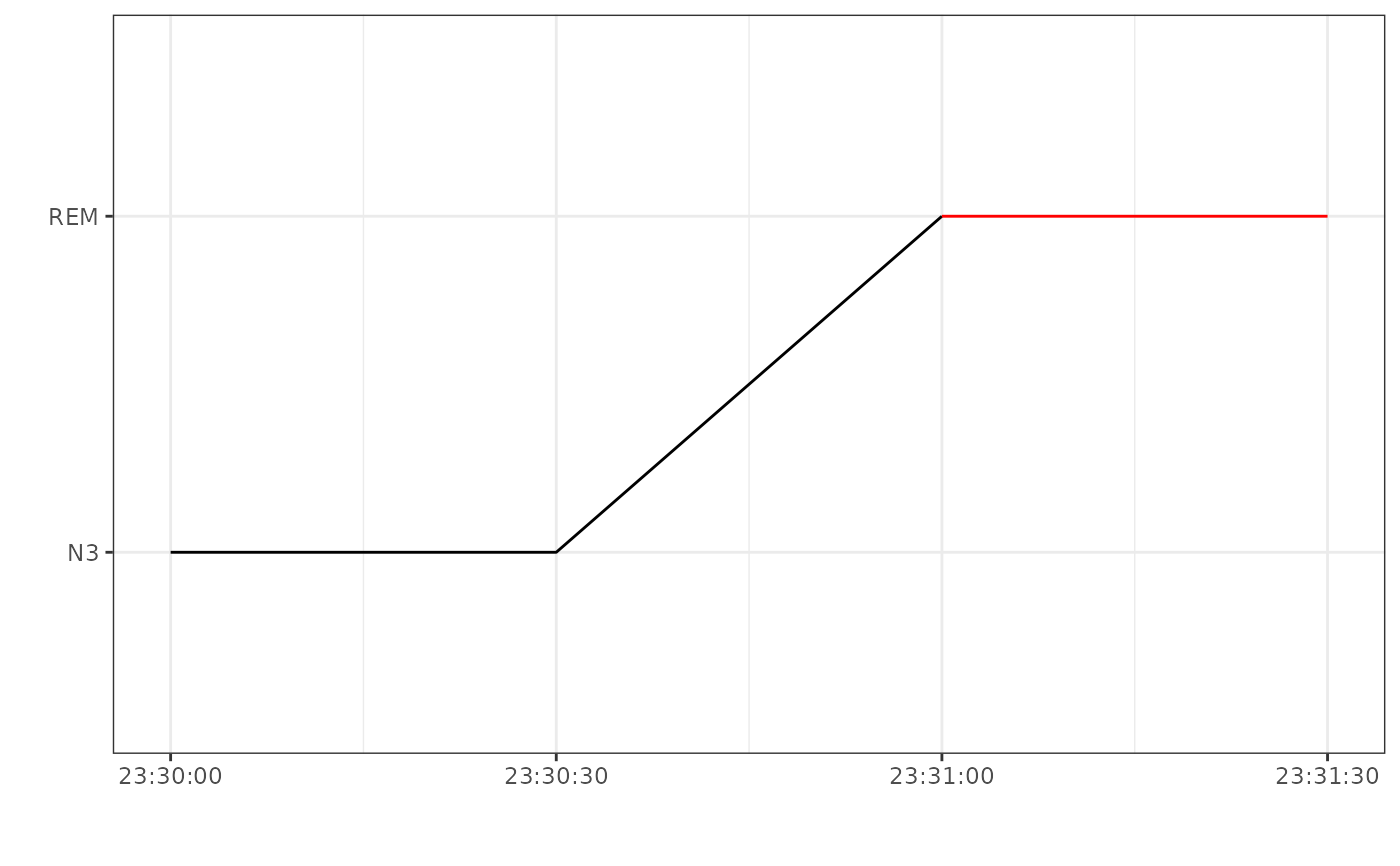
Plot a hypnogram from an events dataframe.
plot_hypnogram(events, labels = c("N3", "N2", "N1", "REM", "AWA"))Arguments
- events
Events dataframe. Dataframe must have
begin(POSIXt),end(POSIXt) andevent- labels
Sleep stages labels. Defaults to
c("N3","N2","N1","REM","AWA").
Value
a ggplot object.
Examples
hypnogram <- data.frame(begin = as.POSIXlt(
c(1536967800,1536967830,1536967860),origin = "1970-01-01"))
hypnogram$end <- as.POSIXlt(c(1536967830,1536967860,1536967890),
origin = "1970-01-01")
hypnogram$event = c("N3","N3","REM")
plot_hypnogram(hypnogram)