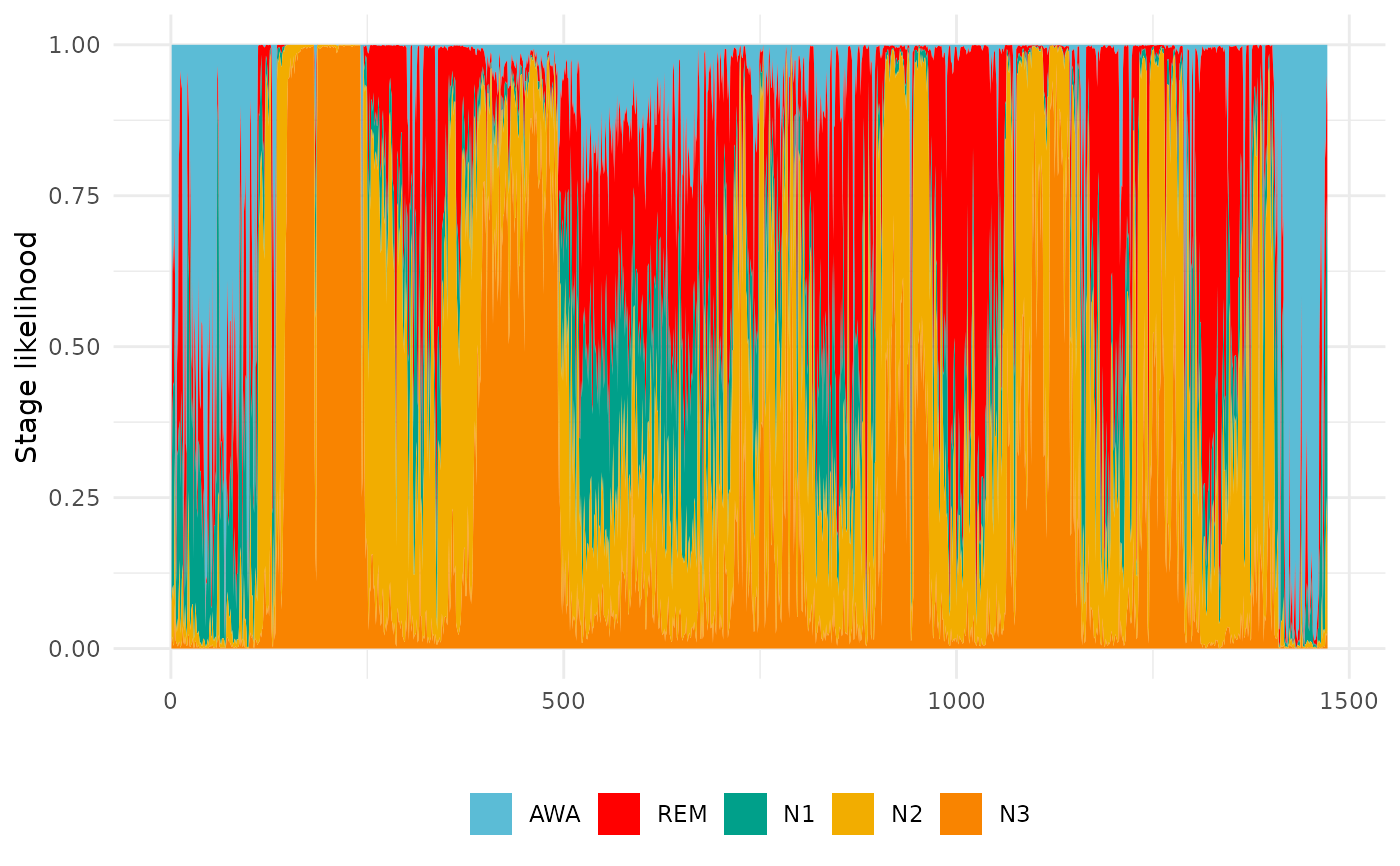
Plot a hypnodensity graph using `ggplot2`. Hypnodensity can be read from file or returned by the `score_stages_edf` function.
Arguments
- hypnodensity
A hypnodensity dataframe as returned by the `score_stages_edf` function.
- stages
Vector of stages labels to plot.
- colors
Vector of colors to use.
Value
A `ggplot2` hypnodensity graph.
References
Stephansen, J.B., Olesen, A.N., Olsen, M., Ambati, A., Leary, E.B., Moore, H.E., Carrillo, O., Lin, L., Han, F., Yan, H. and Sun, Y.L., 2018. Neural network analysis of sleep stages enables efficient diagnosis of narcolepsy. Nature communications, 9(1), p.5229.
Examples
tryCatch({
download.file("https://rsleep.org/data/hypnodensity.csv", "hypnodensity.csv")

hypnodensity <- read.csv2("hypnodensity.csv")

unlink("hypnodensity.csv")

plot_hypnodensity(hypnodensity)
}, error = function(e) {
  print("Error executing this example, check your internet connection.")
  })